


 Back to Blog
By Lauren Nagel
In 2019, the National Research Council of Canada (NRC) released a report on drone propeller icing at high RPM. Their procedure and results are described in two reports on Phase 1 and Phase 2, and we have summarized their key findings in this article.
Introduction
Propeller icing is a danger well known to drone operators and designers. A miscalculation of weather conditions can lead to thousands of dollars in damages and the loss of a valuable aircraft.
As this report shows, changes in performance during icing conditions are non-linear and can be deceiving, potentially causing operators to underestimate the danger to their drone.

The NRC sought to increase this body of knowledge because “data on icing of these propellers at high rotation speeds (RPMs) are almost non-existent”.
Their objectives were to conduct targeted icing tests to characterize icing of small UAS propellers at high RPM, assess the icing impact on the performance of the tested small UAS propellers and their tolerance to icing and establish a baseline database of icing data for icing of small UAS propellers at high RPM.
They looked at six main variables affecting propeller icing during flight:
- Median volume diameter (MVD) of water droplet size, measured in μm
- Liquid water content (LWC) in the test area, measured in g/m3
- Static air temperature (SAT), measured in °C
- Rotor speed, measured at 8000 RPM and 9000 RPM
- Sideslip angle, measured at 0° and 30°
- Blade material, carbon fiber (CF) vs. glass fiber-reinforced plastic (GFR)
Further reading: Why You Should Test Your Drone's Motors and Propellers
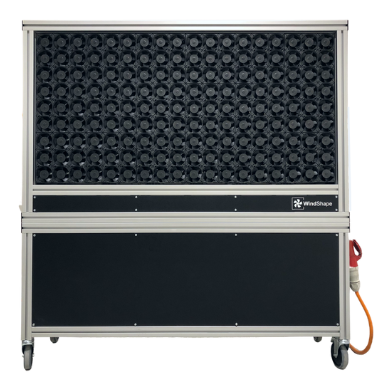
The tests took place within the NRC’s Altitude Icing Wind Tunnel (figure 2). Wind was passed through the test section at 15m/s while an icing spray system provided water droplets to simulate icing conditions.

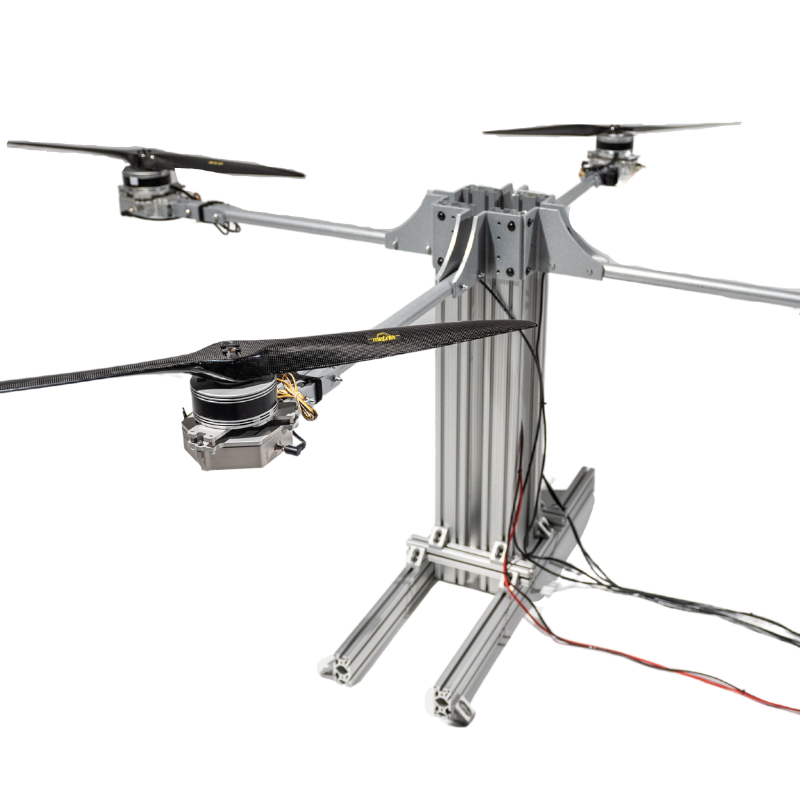
Motor performance was evaluated using the RCbenchmark Series 1580 test stand, capable of measuring 5kgf of thrust and 1.5N.m of torque. In addition to thrust and torque, the test stand provided information on voltage, current, RPM, motor winding resistance, and efficiency.
A custom nacelle was designed and installed on the test stand to protect the equipment from water damage (figure 3). The test rig also included a Turnigy 2834-800 brushless DC electric motor, a Hobbyking 50A Electronic Speed Controller (ESC) and a 4s Lipo (14.8v DC) power supply.

Four propellers were tested in the experiments, ranging from 8” to 14” in diameter. Three of the four propellers were made of carbon fiber (CF) and the fourth was made of glass fiber reinforced (GFR) plastic.
Their characteristics are summarized in table 1. For all experiments, a thrust reduction of 50% was set as the cut-off for ending the test.
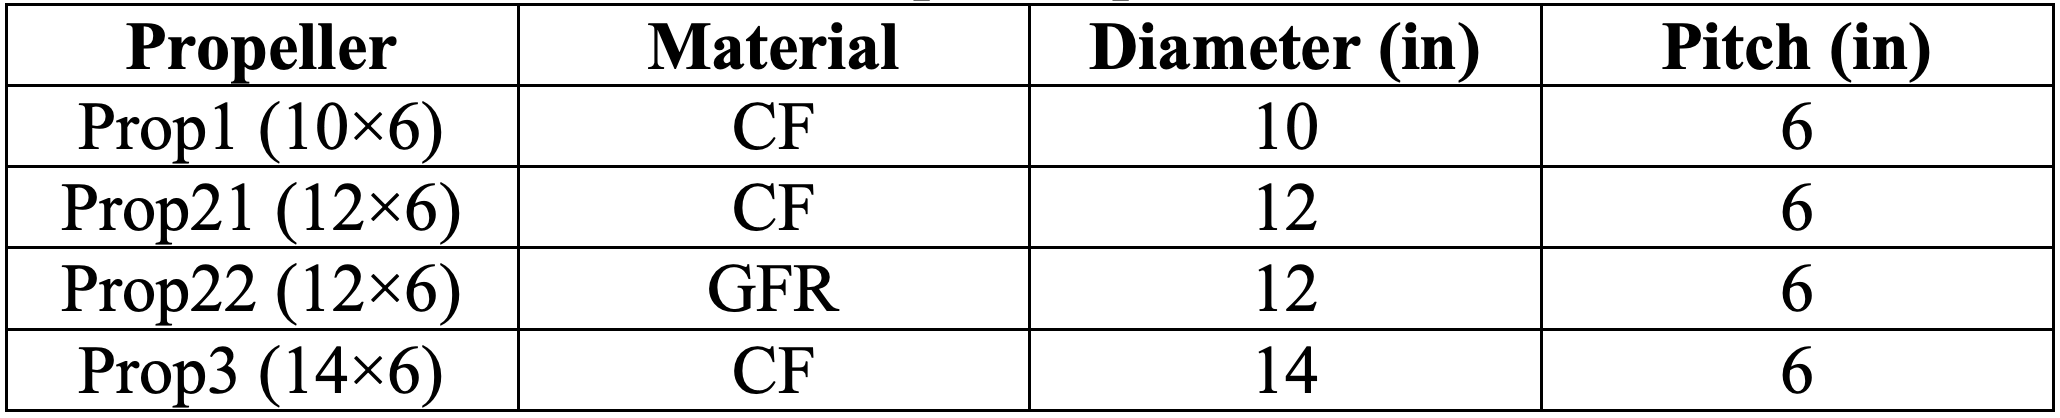
Table 1: Characteristics of propellers used experimentally
Part 1: Median Volume Diameter (MVD) of Water Droplet Size
The first round of tests looked at the effect of water droplet size on ice accretion and propulsion performance for the three CF propellers. The MVD of the water droplets was set at 20, 40 or 60 μm while holding the other parameters constant at RPM = 8000, TAS = 15 m/s, AOS = 0°, SAT = -12 °C and LWC = 0.5 g/m3.
For all propellers at all MVD values, it took about 20s for ice accretion to begin having an impact on thrust, causing a slow and gradual decline in N of thrust.
For Prop1, the reduction in thrust briefly experienced a plateau for MVD = 20μm and 40μm before resuming its decline. This effect was not observed at MVD = 60μm for Prop1, while “similar but shorter plateaus” were observed for Prop21 and Prop3.
Interestingly, it took about twice as long for Prop1 to reach 50% thrust (75 - 130s) compared to Prop21 (48 - 64s) and Prop3 (40 - 47s) (figure 4a).

Figure 4: Thrust increase (a) and torque decline (b) over time at different MVD values
The ice accretion also led to an increase in torque and electric power from the motor. At 50% thrust, Prop1 had reached 150% torque (figure 4b) and 100% electrical power (figure 5) relative to the value at the start of the icing event.
The increases in torque and electrical power were more modest for Prop21 at 100% and 60% and for Prop3 at 40% and 25%.

Figure 5: Electric power increase with ice accretion time
The researchers attribute the thrust plateaus to ice shedding and/or runback ice towards the tips of the propeller blades. The total ice mass and time required for each propeller to reach 50% thrust for MVD = 60 μm is shown in table 2.
The time required decreased with increasing propeller diameter.

Table 2: Ice mass and spray time for propellers to reach 50% thrust at MVD = 60 μm
Part 2: Liquid Water Content (LWC)
This series of tests aimed to investigate the effect of varying LWC in the test area on propeller icing and performance. The LWC was set at 0.2, 0.5 or 1.0 g/m3 while other variables were held constant at RPM = 8000, TAS = 15 m/s, AOS = 0°, TAS = -12°C and MVD = 20 μm.
LWC had a similar but more pronounced effect on icing tolerance compared to MVD. As LWC increased, the time required to reach 50% thrust decreased.
There were significant differences in ice accretion time for the three LWC values, taking 20 - 50s to reach 50% thrust for LWC = 0.2 g/m3, 45 - 130s for 0.5 g/m3 and 120 - 430s for 1.0 g/m3.
Similar to the MVD results, the thrust plateaued for a period for all three LWC values, though the plateaus were more significant for 0.2 and 0.5 g/m3 compared to 1.0 g/m3. Correspondingly, no ice shedding was observed for LWC = 1.0 g/m3, partially explaining the more rapid decline to 50% thrust (figure 6).
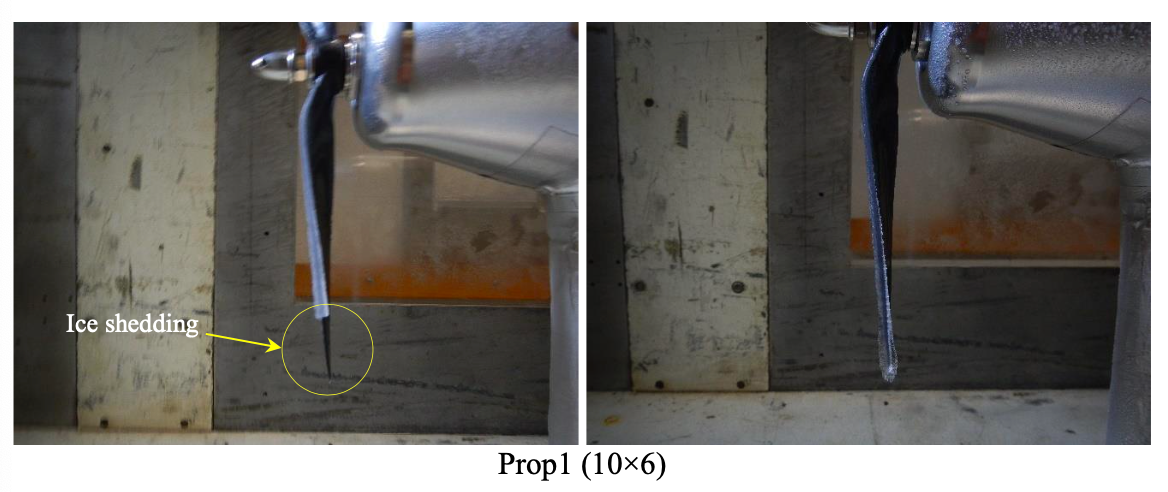
Figure 6: Ice shedding at LWC = 0.2 g/m3 (left) but not at LWC = 1.0 g/m3 (right)
Also similar to the MVD results, an increase in torque and electrical power was observed, which was highest at LWC = 0.5 g/m3. At this LWC level, the increases in torque and electrical power were 130% and 80% for Prop1, 100% and 60% for Prop21, and 30% and 20% for Prop3.
Overall, LWC had a more significant effect on icing tolerance than MVD, as demonstrated by the reduced time it took to reach 50% thrust when LWC = 1.0 g/m3 (table 3).

Table 3: Ice mass and spray time for propellers to reach 50% thrust at LWC = 1.0 g/m3
Part 3: Static Air Temperature (SAT)
The third set of tests looked at the effects of SAT on icing tolerance by investigating three SAT values of -2°C, -5°C and -12°C while holding other variables constant at PM = 8000, TAS = 15 m/s, AOS = 0°, MVD = 20 μm and LWC = 0.5 g/m3.
All three propellers experienced the most rapid decline in thrust at SAT = -12°C followed by SAT = -5°C. Interestingly, at SAT = -2°C, Prop21 and Prop3 never reached 50% thrust, maintaining at least 80% of original thrust for the entire experiment.
At SAT = -5°C, Prop1 and Prop21 underwent several ice shedding cycles, with Prop1 eventually reaching 50% thrust but Prop21 never declining to that point. Prop1 was the only propeller to reach 50% thrust at all three SAT values (figure 7).

Figure 7: Thrust increase (a) and torque decline (b) over time at different SAT values
Ice accretion and shedding also had an impact on vibration levels. Vibration was measured by the test stand in terms of gravitational acceleration (g).
Increased vibration was observed with increased ice buildup followed by lower vibration when ice was shed from the propeller (figure 8).

Figure 8: Vibration due to ice shedding cycles
Part 4: Rotor Speed
The next set of tests studied icing tolerance at 9000 RPM, 1000 RPM higher than the previous tests at 8000 RPM. In these tests LWC and SAT were varied, as these variables had a greater impact on tolerance than MVD in the previous tests.
Overall, the increase in rotation speed to 9000 RPM was insufficient to cause significant changes in ice accretion and loss of thrust.
This is demonstrated in figure 9, which compares the normalized thrusts at 8000 RPM and 9000 RPM for the worst-case icing conditions of SAT = -12°C, MVD = 20 μm and LWC = 1.0 g/m3 with Prop21.

Figure 9: Normalized thrust over time at 8000 RPM and 9000 RPM for Prop21
The investigators performed a visual inspection of the propeller blades post-test and noted that there was greater ice shedding at 9000 RPM under certain conditions. However, this did not lead to significant performance differences between the two conditions.
Part 5: Sideslip Angle
The fifth set of experiments aimed to measure propeller icing tolerance for a UAV in forward flight, simulated by tilting the propeller to an angle of sideslip (AOS) of 30° relative to the wind tunnel’s airflow.
Rotation speed was set at 8000 RPM and MVD at 20 μm. LWC was varied between 0.2, 0.5 and 1.0 g/m3 and SAT was varied between -2, -5 and -12 °C.
Further reading: Propulsion Testing with a Wind Tunnel at the University of Ottawa
At the beginning of the icing event they observed an increase in dynamic thrust, which they attribute to the decrease in effective airspeed seen by the propeller at 30°, which is 13 m/s rather than 15 m/s.
The 30° angle did not otherwise cause a noticeable difference in the icing tolerance of Prop21, which was again tested in the worst-case icing conditions (SAT = -12°C, MVD = 20 μm and LWC = 1.0 g/m3) (figure 10).

Figure 10: Normalized thrust over time at 0° and 30° AOS for Prop21
Part 6: Blade Material
The final test studied the different icing tolerance of GFR blades compared to CF blades. The GFR propeller (Prop22) was tested in the same conditions as the CF with the same diameter, (Prop21), holding AOS at 0° and RPM at 8000, while LWC was varied between 0.2, 0.5 and 1.0 g/m3 and SAT was varied between -2, -5 and -12 °C.
Two major differences were observed for the GFR propeller, the first being a more rapid decrease in thrust compared to Prop21 for LWC = 0.2 g/m3.
The second difference was that Prop22 experienced a decrease in thrust of about 25% prior to ice shedding at SAT = 2 °C (figure 11), a condition which did not affect the thrust of Prop21.
As a result, there was a corresponding increase in torque and electric power, which was also not observed for Prop21. Otherwise, the icing tolerance of the GFR propeller was very similar to that of the CF propeller in the same conditions.

Figure 11: Thrust, torque and power vs. ice accretion time for Prop22
Conclusion
This study has done an excellent job of characterizing the icing tolerance of small UAV propellers at high RPM. The results present several practical takeaways that drone operators can make use of.
First, larger propellers took less time to drop to 50% thrust as ice accumulated on the blades, suggesting that propeller diameter plays a role in icing tolerance. Furthermore, GFR blades were less tolerant to icing than CF blades, losing thrust more easily.
The study also demonstrated that performance metrics can be misleading if they are not well understood. During several of the tests, the thrust decline experienced a plateau due to ice shedding from the propellers.
This effect could lead a drone operator to believe that the icing impact has peaked, however, these plateaus were immediately followed by a steep decline in thrust.
These experiments confirmed that propeller icing generally gets worse rather than better without intervention, so drone operators should be very familiar with the meanings behind changes in performance.
The researchers at the NRC look forward to performing more experiments with larger propellers to further add to this knowledge base.
Further reading: How to Measure Brushless Motor and Propeller Efficiency


Leave a comment