
 Back to Blog
Dynamometers are excellent tools for measuring the performance of motors. By applying a controlled load to the motor, dynos can characterize motor torque, RPM, and power.
But is this the only way to get a comprehensive understanding of motor performance?
We wanted to know if it was possible to map motor performance without a traditional brake dynamometer, using a motor-propeller thrust stand instead.
(Spoiler alert: it is indeed possible.)
Table of contents:
-
Experimental setup
-
Motor power consumption map
-
Motor efficiency map
1. Experimental setup
We used our Flight Stand 15 thrust stand to measure motor performance in terms of torque, RPM, power and more.
We installed 6 different propellers of various brands on the motor, using them as loads for our test. Their sizes were as follows:
-
11”
-
16”
-
18”
-
22”
-
26”
-
30”

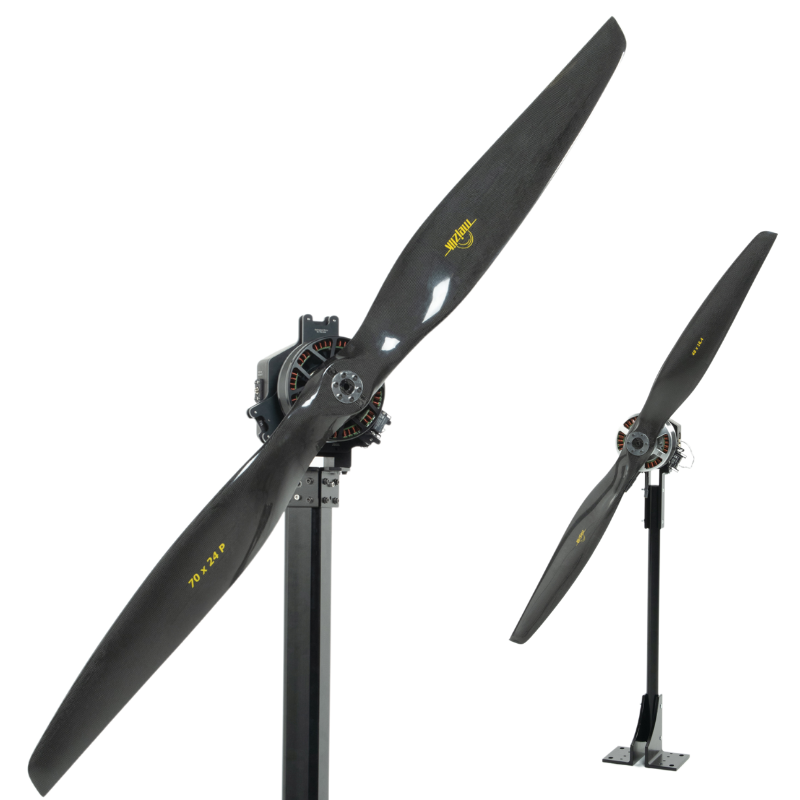
Figure 1: Flight Stand thrust stand with test motor and propellers
We designed an automated step test with 10 throttle increments from 1150 to 2000 µs, and performed the test with each propeller.
Data was recorded using the Flight Stand software, then exported to .CSV.
Motor maps were generated using a Google Colab notebook executing Python.The code can be viewed and repurposed using your own motor performance data files. To use your own data, you will need to use the same units and column titles as what was used in the exported file or modify the code to accommodate your choice of unit.

Figure 2: Step test automated in Flight Stand software
2. Motor power consumption map
Four variables are presented on the graph below. The x-axis presents rotation speed in RPM while the y-axis presents torque in Nm. The contour plot is the modelled power. The points represent the real data points measured, and their colour represents the difference between the measurement and the model.
A third order polynomial was applied to the data to model electrical power consumption. The predictions are represented by the coloured sections on the graph, each representing a 25 W range.
The colour of the data points represents the error between the model predicted value and the measured value of electrical power in Watts. The maximum error of the model was 0.8 Watts on 150 measured Watts, or 0.5%.

Figure 3: Map of motor power consumption
Recommended for you: BLDC Motor Power and Efficiency Analysis
3. Motor efficiency map
The map of motor efficiency below was derived from the power map in the previous section.
In this map, each coloured section represents predicted motor efficiency in %, with each section occupying a 2% range.
At very low efficiencies, <50%, the error on the measurement was up to 3 percentage points, which is expected as the power measured and the torque are quite low in those ranges. At higher efficiencies where the motor normally operates during flight, the error was much more negligible, <1 percentage point for efficiencies ranging from 74-86%.

Figure 4: Motor efficiency map
Conclusion
In summary, it is indeed possible to map motor power and efficiency without a traditional brake dynamometer. We were able to use data from our Flight Stand thrust stand and a third order polynomial to model motor power consumption and efficiency, generating maps to predict performance in configurations not yet tested.
To learn more about motor characterization, check out our article on How and Why to Measure Motor Torque


Leave a comment