
 Back to Blog
By Lauren Nagel
Our Flight Stand thrust stands allow you to export data at any resolution from 1 to 1,000 Hz. This is a powerful feature that opens up a lot of testing and analysis possibilities.
But what does data sampled at 1,000 Hz look like? And what’s really the difference between 10 Hz, 100 Hz and 1,000 Hz?
In this article we will demonstrate the different levels of precision and analysis that are possible with data measured at each of these resolutions.
Table of Contents:
- Do you need a high sampling rate
- Sampling rate by application
- Data comparison at 10, 100, and 1,000 Hz
- Torque and current fluctuations
- Vibration
- Motor and ESC reaction time
Do you need a high sampling rate?
Dynamic testing is a test in which the values measured change relatively quickly. Acceleration tests, vibration measurement, torque ripple measurement are examples of dynamic tests. Mathematically, those are tests in which the value measured changes as a function of time, and an average value is not sufficient.
To achieve these results, dynamic testing requires a minimum sampling rate that is twice the frequency of the signal being measured. This is known as the Nyquist frequency, and it is the minimum sampling rate necessary to avoid aliasing and ensure that the signal being measured is accurately represented.
Static testing is a test in which the measured values are changing slowly. There are fewer requirements when doing static testing: the measurement synchronization is not as demanding, filters with higher time constants can be used, and the sampling rate can be lower.
Real-time testing describes a test where the timestamps associated with the measured values exactly match the timestamps at which the analog measurements are taken on the circuit board.
Filtering, especially low pass filtering, is a technique used to remove high frequency data from the signal. In a thrust measurement test, a low pass filter could remove the vibration, the noise in the current caused by the fast switching of the transistors, or the torque ripple. A high sampling rate is not sufficient to measure a dynamic test. The low pass filter applied on the data should have a cutoff frequency of at least twice the sampling rate so the filter does not remove important data.
To learn more about high speed testing, check out our article on Dynamic Testing in Data Measurement.
Sampling rate by application
The amount of information you are able to obtain depends on the sampling rate of your data collection.
Here’s a few examples of what you can analyze at different sampling rates:
- 10 Hz
- Steady-state, static measurements
- Observe the general evolution of thrust, torque, RPM, voltage, and current
- 100 Hz
- Characterize large motor reactions to input changes
- Visualize trends and fluctuations
- 1,000 Hz
- Torque ripple
- Current analysis
- Vibration analysis
- Reaction time analysis
Data Comparison at 10, 100, and 1,000 Hz
To demonstrate the differences in data at different resolutions, we performed a simple acceleration test (0 to 1436 µs) at 1,000 Hz, then resampled and exported the data at 10, 100, and 1,000 Hz using the Flight Stand software.
We plotted the measured variables on the graphs below, showing their behavior at three different resolutions. Note: the PWM and RPM values were adjusted to fit on the axes below while demonstrating the evolution of those two parameters.


As the sampling rate becomes higher, we can see a much more detailed picture of the evolution and variation of each variable.
We can look at the data from several angles to demonstrate the different levels of analysis possible at each resolution.
Torque and Current Fluctuations
First, we will look at the torque and current fluctuations in this data, since torque is directly related to current.
To begin, at 10 Hz, we can see the major fluctuations in both of these variables. It appears that there are two major spikes in current, and one major spike in torque. The torque peaks around the 3.9 second mark at just about 4 Nm. The current also peaks at the 3.9 second mark to just under 6 A, then again at about 4.4 seconds, just crossing the line at 10 A. At this resolution, the data suggests that there may be a relationship between torque and current, but it is not obvious.
At 100 Hz, you can see that torque and current have a similar waveform and fluctuate at a similar frequency. The torque peaks at 3.68 seconds at about 5.5 Nm, and starts to resemble a torque spike. The current peaks at 4.46 seconds at just over 10 A.
At 1,000 Hz, we can really start to see the co-evolution of torque and thrust. The torque peaks at 3.670 seconds at just over 6 Nm and it is now evident that it is a torque spike. The current peaks at 4.410 seconds at about 10.7 A. At this resolution, we can determine which torque peaks are associated with peaks in the current, and which ones are not.
In this analysis we uncovered several torque peaks, including a torque spike at the beginning of the test when the motor’s acceleration began. This spike in torque occurs due to the extra effort required for the motor to start spinning from a stationary position. The spike in torque is very short and only visible with a high sampling rate.
The true max torque (>6 Nm) was much higher than what was measured during the 10 Hz test (~4 Nm), a 40% difference. This is important for designers to know, as the strain on the propulsion system may be much higher than anticipated.
The other torque peaks that are not associated with current peaks can be indicative of misalignments or inefficiencies in the propulsion system, and may warrant further investigation.
This type of analysis can be crucial for identifying weak points in your design.
Further Reading: How to Measure Torque and Why You Should
Vibration
Vibration is an important variable when it comes to testing propulsion systems as it can affect the security of the vehicle's structure and the longevity of its components.
One way to quantify vibration, measured as the fluctuations in acceleration, is with a Fourier Transform (FT) analysis. A limitation of this technique is that the Nyquist limit requires the minimum sampling rate must be 2x the given frequency to be measured accurately. For this reason, it is important to start with data measured at high frequency.
For example, a 50 Hz data measurement will allow you to measure events that happen at a frequency of 25 Hz and lower. Same for 1,000 Hz, you can only measure events that happen at frequencies lower than 500 Hz.
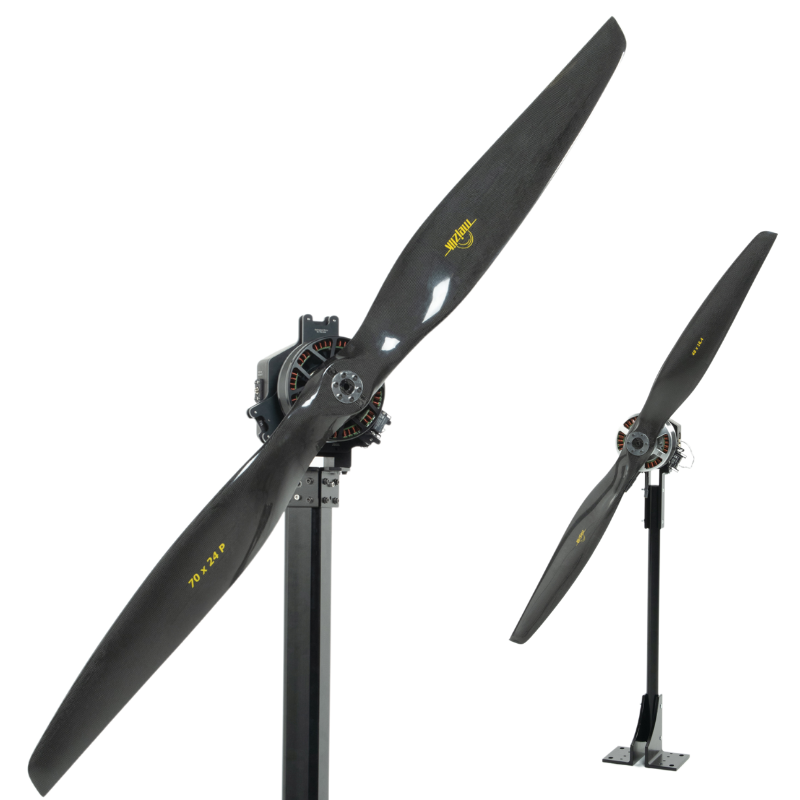
The graph below shows the results of a DFT analysis performed on data from two different propulsion systems, called configuration 1 and configuration 2. A constant thrust test was run with both systems for 30 seconds, maintaining ~3180 RPM, equivalent to 53 Hz. The top graph shows the results for thrust and the bottom graph for torque.
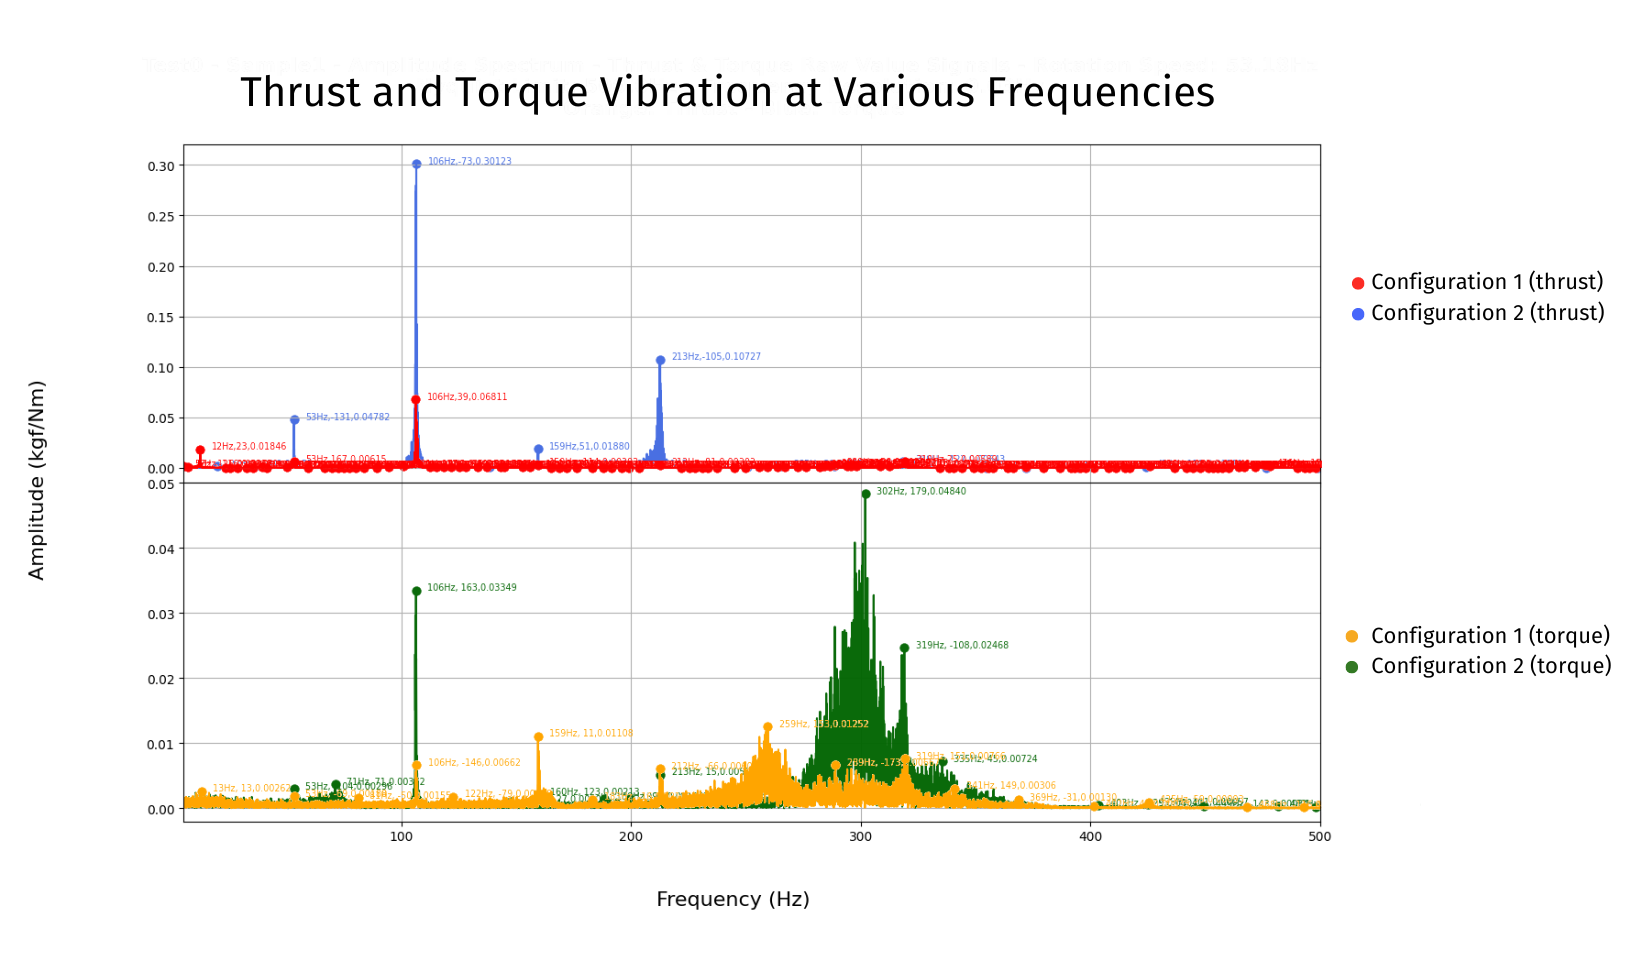
Here’s what we can see in these results:
- As demonstrated by the amplitude of the peaks, there is 4.5x higher variation in the thrust spectrum in configuration 2 compared to configuration 1, as well as 3.7x higher variation in the torque spectrum.
- There is visible vibration at the 1st, 2nd, 3rd and 4th harmonics (53, 106, 159 and 213 Hz) across the configurations.
- The peak at 106 Hz shows where the propeller crosses the thrust stand’s structure.
There are several other vibration peaks whose source is less easily identified.
They may be attributable to several other sources, which can be confirmed with further analysis:
- Turbulence of the incoming air
- The power supply's AC input frequency
- Propeller deformation
- Rotor not properly balanced
- Misalignment of the motor mounting screws
- Inconsistent ESC output
- Structural interaction with the fluid (due to pressure changes)
Further Reading: Reducing Vibration in Propulsion Testing
Dynamic Response of the Motor and ESC
The speed of the motor and ESC are not perfectly constant, and the fluctuations are visible in data measured at higher sampling rates. At 1,000 Hz we can look at their reaction time and dynamic response.
For the motor, thanks to the precise timing of the control, the thrust stand can characterize reaction time and the dynamic response of the motor.
An example is the negative torque that becomes visible as the sampling rate is increased. In the acceleration curves below, at 50 Hz we can see a negative torque peak of about 1.6 Nm become visible around the 3.64 seconds mark. At 1,000 Hz, we can see that it is in fact 2 peaks, the larger of which peaks at about 2.2 Nm.


This type of analysis can also be useful characterizing ESCs, which use transistors that pull a high amount of current quickly. You may decide to vary the wire length or capacitors used to change the response time and minimize current spikes. Data measured at 1,000 Hz can show you the difference in reaction time created by those changes.
Additionally, most ESCs use a frequency higher than 50 Hz, so a higher sampling rate is required to see variations in the current delivered and subsequent changes in the parameters like speed and thrust.
Summary
In summary, data collected at 1,000 Hz offers many possibilities for in-depth analysis of your motors, propellers, ESCs, and overall system.
In this article we have looked at how data collected at 1,000 Hz can help study torque and current fluctuations, system vibration, and reaction time. This information can help you gain a better, more precise understanding of your system’s performance in order to make improvements in your design.
For more information on how to improve drone performance, check out our eBook on Drone Building and Optimization.
If you’d like to start testing your motors, propellers, and ESCs at 1,000 Hz, check out our propulsion thrust stands:
- Flight Stand 15 (15 kgf / 8 Nm)
- Flight Stand 50 (50 kgf / 30 Nm)
- Flight Stand 150 (150 kgf / 150 Nm)
- Flight Stand 500 (500 kgf of thrust / 1500 Nm)


Leave a comment