


 Back to Blog
By Lauren Nagel
Many electric motor manufacturers promise impressive performance up to and beyond 95% efficiency.
The numbers on the datasheet are impressive, but do the real values measure up?
We conducted a study using motor efficiency data to try and answer the question: What is the Average Efficiency of an Electric Motor?
There are no industry standards for testing and presenting motor performance figures, so it is nearly impossible to compare manufacturers during the purchasing process.
That’s why we are big supporters of testing your motors yourself, as it allows you to determine their true performance and find the best one for your design.
In this article we will cover:
- How we Measured Average Motor Efficiency
- Study Limitations
- The Average Efficiency of an Electric Motor - What the Data Shows
1. How we Measured Average Motor Efficiency
Along with our testing equipment, we offer a free online database of motor performance data.
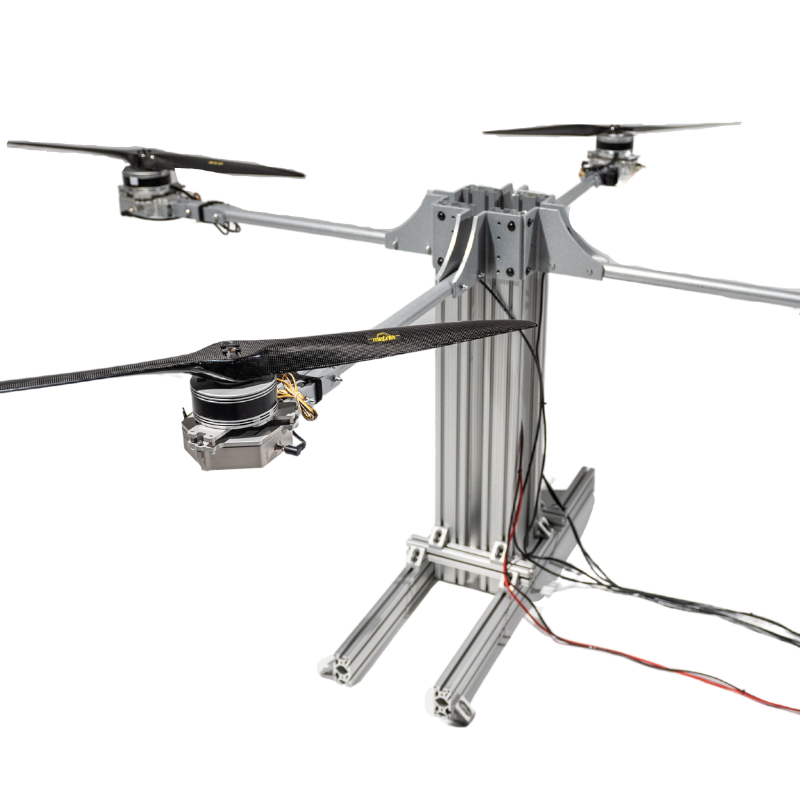
This data has been collected and uploaded by the users of one of our electric motor test stands, either the Series 15XX or the Series 1780.
These test stands collect data on thrust, torque, RPM, current, voltage, electrical power, mechanical power, motor & ESC efficiency, propeller efficiency, and overall propulsion system efficiency.
Click here to see the formulas used to determine these values.

At the time we are writing this article, the database contains motor & ESC efficiency data for 48 unique motors. In creating the short list, we were careful to account for duplicates and tests with missing data.
Once the motor list was finalized, we looked at the data for each of the motors. For some motors there was only one test performed whereas for others there were as many as 22 tests.
For each motor we looked at all the data points available and used the ‘maximum observed efficiency’ value for our analysis.
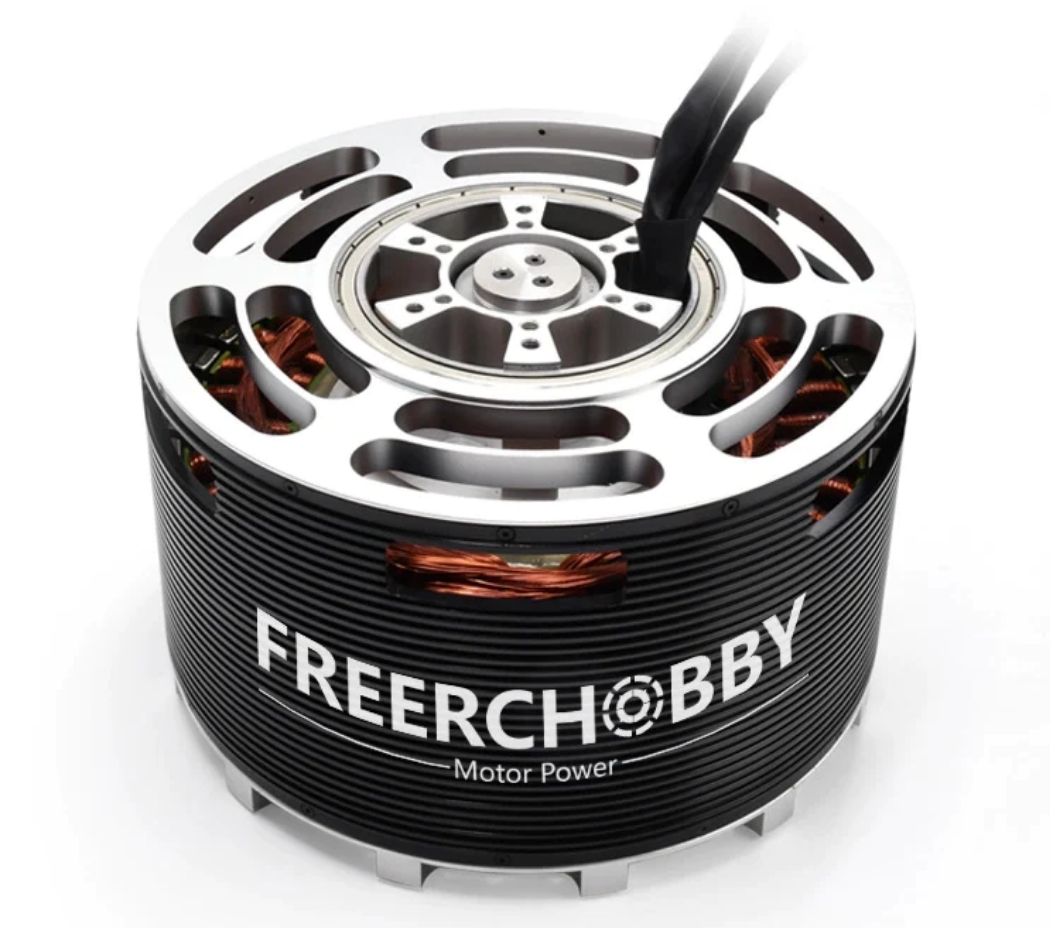
For the motor below, for example, there were 8 tests available, and we used the max observed efficiency value (indicated by the blue arrow) from all of the tests for our analysis. It is important to understand that because different propellers were used, the torque applied was different between tests. The motor efficiency is a function of RPM and torque.

While we cannot guarantee that this is the motor’s true maximum efficiency, it is the highest efficiency that is observable with the data available. Due to this limitation and others, we will not be naming the motors included.
Further reading: Brushless Motor Power and Efficiency Analysis (article)
In our analyses we compared the efficiency of all the motors, and also that of subgroups based on weight. The boundaries were created to try and have an equal number of motors in each group, while grouping them with motors of a comparable size.
There is a gap in weight between the second last and last group in order to more clearly represent the size of the motors included.
2. Study Limitations
Before we get into the results, we would like to discuss a few limitations of the study.
This study is purely observational and based on the data available to us in our database. We did not control for the environment of the tests or the type of test performed, nor can we say whether the data uploaded is representative of the motors’ normal performance.
Therefore, this is not a precise comparison. This is simply data we have compiled for interest’s sake and for a general overview of the matter.
While there are certainly others to be considered, below are a few of the limitations of this study.
Study Limitations:
- Our test stands measure ‘Motor AND ESC Efficiency’ so this is what was used in the comparison. From experimental tests, we know that the same motor at a given speed and torque can have a 10% variance due to ESC type and settings.
- The data used is-user submitted data so we have no control over the test conditions.
- For some motors there were multiple tests available while for others there was only one, so the number of samples considered was not consistent.
- The tests included were not performed with the intent of identifying the highest possible efficiency, so the “maximum efficiency” of some motors may be underestimated.
- For most motors the weight data was included with the test, but for a few tests it was missing. For these tests we performed research based on the motor information provided and filled in the weight. We used the ‘weight without wiring’ value, but we cannot confirm whether the motors with weight data already present included wire weight or not.
3. The Average Efficiency of an Electric Motor - What the Data Shows
First off, let’s look at the motor efficiency data of the group as a whole.
The average maximum percent efficiency for all 48 electric motors included in the study is: 77.64%.
Considering that the data was not collected for maximum efficiency purposes, that’s not bad. This is likely a good estimate of typical electric motor efficiency.
The highest maximum efficiency observed was 97.61% and the lowest was 55.79%.
The graph below shows the maximum efficiency distribution:

When we break it down further into groups based on weight, this is what we observe:
|
Weight Category (g) |
Average Maximum Efficiency |
|
3.9 - 30.0 |
70.80% |
|
30.1 - 36.0 |
67.63% |
|
36.1 - 70.0 |
79.98% |
|
70.1 - 159.0 |
82.78% |
|
159.1 - 255.0 |
84.13% |
|
1093.0 - 5130.0 |
85.42% |

As you can see, there is an overall trend towards increasing efficiency as the weight of the motor increases.
If you include all the data points individually, the trend is similar though dispersed:
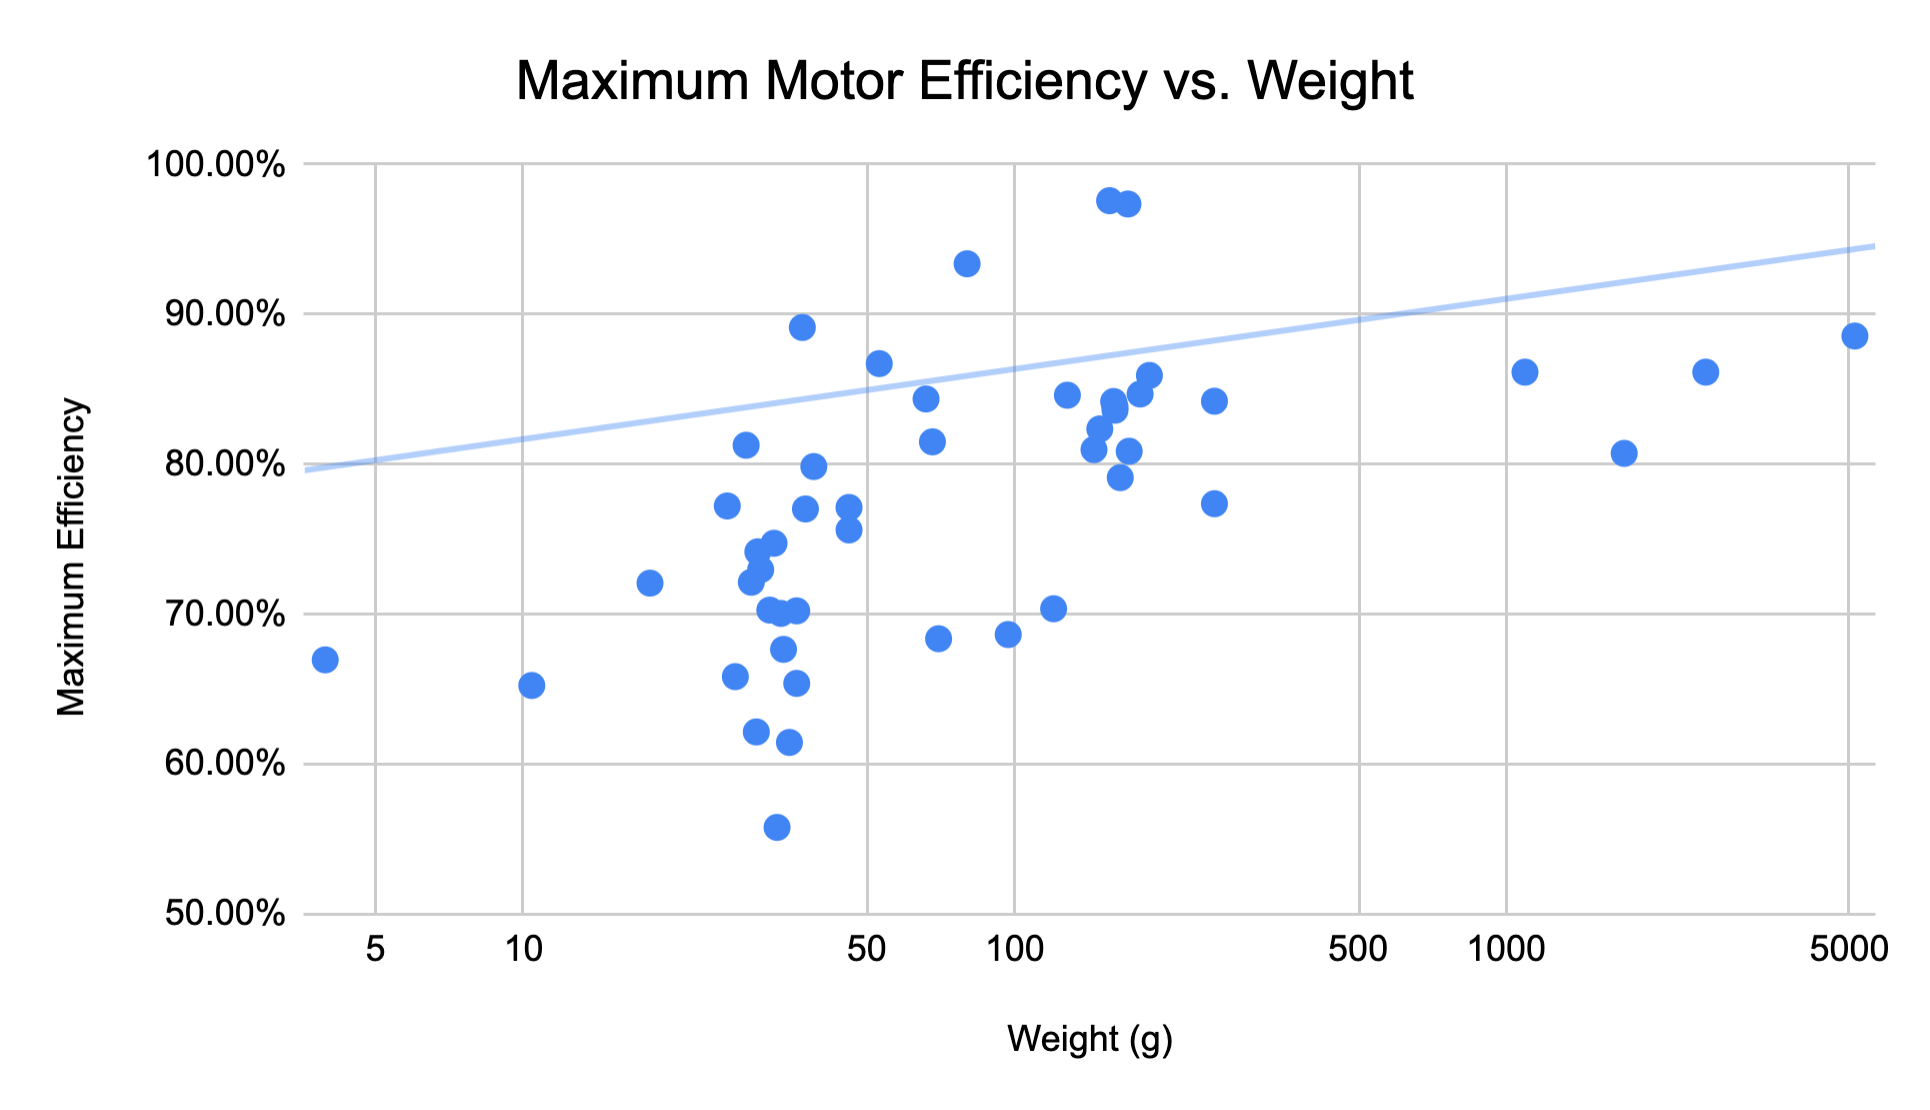
These graphs tell us that in general, we can expect to see a higher maximum efficiency as the size of the motor increases. This is in line with the common knowledge of the industry today.
We can also see that there is a wide range of efficiencies for motors of the same size, especially for motors around 30 - 50 g in weight.
For most UAVs, swapping a motor at the bottom of the range with one at the top of the range could increase your flight time by several minutes.
Conclusion
In conclusion, according to this observational study:
- On average, larger motors have higher efficiency
- There is a large range of efficiencies for motors of the same size
- Efficiency figures are very dependant on use case and propeller selection
- It is very important to test your motors
If you would like to get started with testing your electric motors and propellers, check out our propulsion testing tools:
- Series 1585 - measures up to 5 kgf of thrust / 2 Nm of torque
- Flight Stand 15 - measures up to 15 kgf of thrust / 8 Nm of torque
- Flight Stand 50 - measures up to 50 kgf of thrust / 30 Nm of torque
- Flight Stand 150 - measures up to 150 kgf of thrust / 150 Nm of torque


Francky
August 08, 2023
Thank you for sharing this informative article on Electric Motors